PyScanCf Example 1#
author: @syedhamidali
date: Apr 15, 2023
import pyscancf as pcf
import pyart
import glob
print(pcf.__version__)
1.0.24
Setup the paths for the input and output data, !ls $inp shows the raw IMD data files, this is how the B-type (short range - high resolution) IMD DWR data looks like.
inp = "/Users/syed44/Downloads/Git_Stuff/imd_temp_radar/B/"
out = "/Users/syed44/Downloads/Git_Stuff/imd_temp_radar/out/"
!ls $inp
GOA210516024101-IMD-B.nc   GOA210516030244-IMD-B.nc
GOA210516024101-IMD-B.nc.1 GOA210516030244-IMD-B.nc.1
GOA210516024101-IMD-B.nc.2 GOA210516030244-IMD-B.nc.2
GOA210516024101-IMD-B.nc.3 GOA210516030244-IMD-B.nc.3
GOA210516024101-IMD-B.nc.4 GOA210516030244-IMD-B.nc.4
GOA210516024101-IMD-B.nc.5 GOA210516030244-IMD-B.nc.5
GOA210516024101-IMD-B.nc.6 GOA210516030244-IMD-B.nc.6
GOA210516024101-IMD-B.nc.7 GOA210516030244-IMD-B.nc.7
GOA210516024101-IMD-B.nc.8 GOA210516030244-IMD-B.nc.8
GOA210516024101-IMD-B.nc.9 GOA210516030244-IMD-B.nc.9
help(pcf.cfrad)
Help on function cfrad in module pyscancf.pyscancf:

cfrad(input_dir, output_dir, scan_type='B', dualpol=False, gridder=False, plot=None, nf=None)
    Aggregates data to cfradial1 data.
    input_dir(str): Enter path of single sweep data directory,
    output_dir(str): Enter the path for output data,
    scan_type(str): "B", "C".
            B is for short range PPI, & C is for long range PPI.
    dualpol(bool): True, False.
            (If the data contains dual-pol products e.g., ZDR, RHOHV),
    gridder(bool): True, False,
    plot(str): 'REF', 'VELH', 'WIDTH', 'ALL',
    nf(int): Number of files to group together
Let’s see what we have got into pcf.cfrad() function.
It aggregates data to cfradial1 data. It takes inputs such as
input_dir,output_dir,scan_type,dualpol,gridder,plot, andnf.input_dirspecifies the path of single sweep data directory, whileoutput_dirspecifies the path for output data.scan_typetakes two options:Bfor short-range PPI, andCfor long-range PPI.The
dualpolparameter is set to True if the data contains dual-polarization products like ZDR and RHOHV.gridderis a boolean parameter, which is set to True if the user wants to create a gridded output.The
plotargument is used to generate a cappi plot. It can be set toREF,VELH,WIDTH, orALL. The names are not case-sensitive and will be taken care of by theplot_cappi()function. For example, if the data has areflectivityfield namedDBZ, you can still writeREForreflectivity, and same is for other radar moments.Lastly,
nfis an integer parameter that specifies the number of files to group together, it is usually10for typeB, and2or3for typeCdata.
pcf.cfrad(input_dir=inp, output_dir=out, scan_type="B", gridder=True)
Number of files:  20
Total number of files will be created:  2
Merging all scans in one file
Data merging done
Total Time Elapsed:  0:00:32.381215
!ls $out
Max-REF_GOA_20210516024104.png cfrad_GOA210516030244-IMD-B.nc
Max-REF_GOA_20210516030306.png grid_GOA210516024101-IMD-B.nc
cfrad_GOA210516024101-IMD-B.nc grid_GOA210516030244-IMD-B.nc
files = glob.glob(out+"grid*")
for file in files:
grid = pyart.io.read_grid(file)
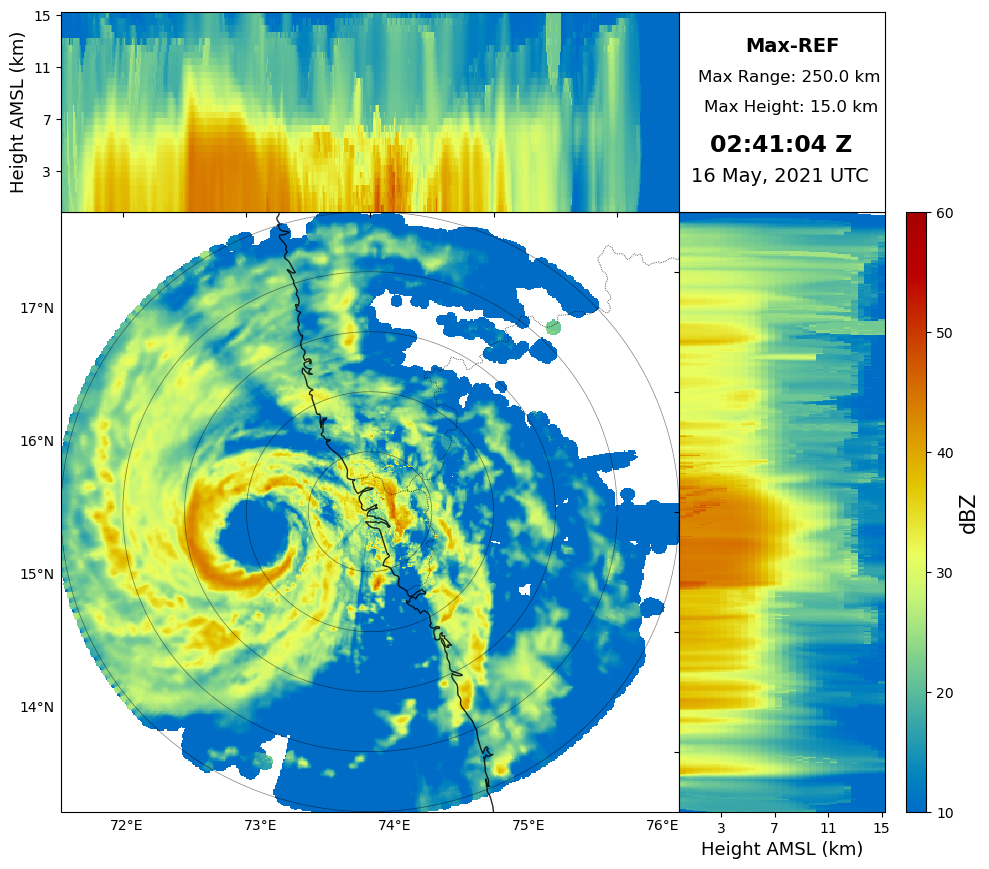
pcf.plot_cappi(grid, "REF",
cmap="pyart_HomeyerRainbow", #optional
crosshair=False, #optional
savedir=None, #optional
show_figure=True, #optional
)
...............................
Plotting Max-REF 20210516024104
...............................
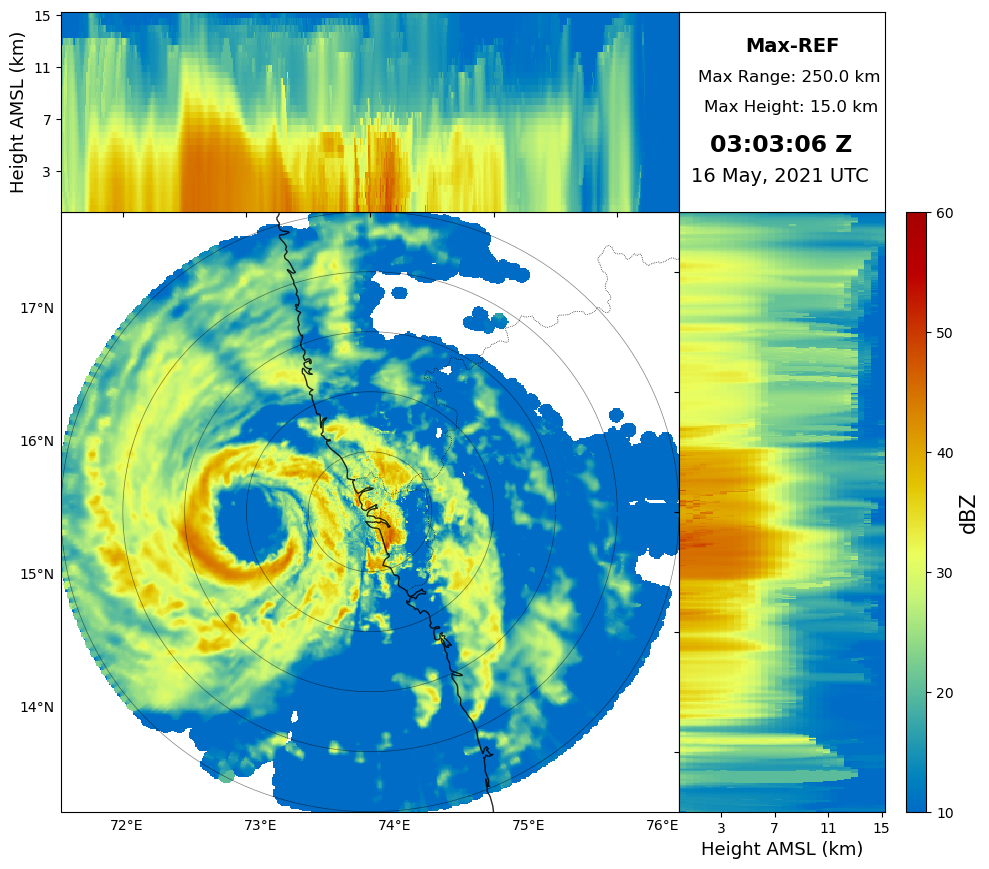
...............................
Plotting Max-REF 20210516030306
...............................
for file in files:
    grid = pyart.io.read_grid(file)
    pcf.plot_cappi(grid, "REF",
                   cmap="pyart_HomeyerRainbow", #optional
                   crosshair=False, #optional
                   savedir=out, #optional
                   show_figure=False, #optional
    )
...............................
Plotting Max-REF 20210516024104
...............................

Figure(s) saved as /Users/syed44/Downloads/Git_Stuff/imd_temp_radar/out//Max-REF_GOA_20210516024104.png
...............................
Plotting Max-REF 20210516030306
...............................

Figure(s) saved as /Users/syed44/Downloads/Git_Stuff/imd_temp_radar/out//Max-REF_GOA_20210516030306.png